

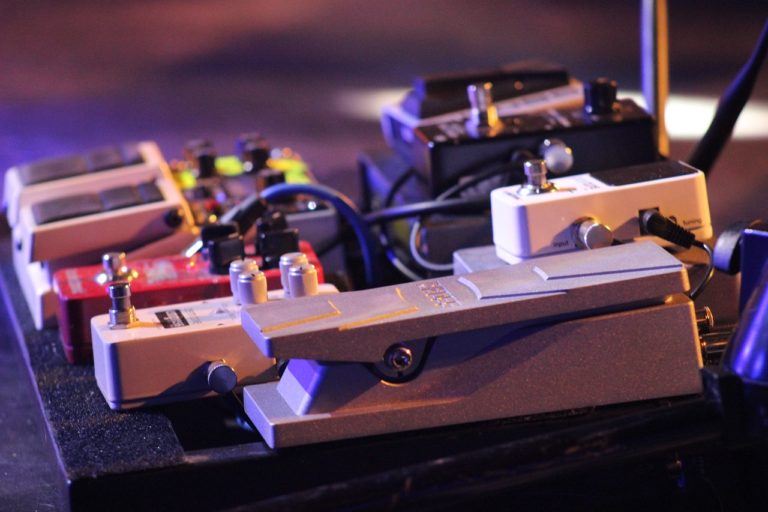
Lately, I’ve been working on a programmable guitar pedal, which involves electronic-tweaking of sound signals produced by a guitar. This time, I chose a rather more engineering-oriented approach involving a bit of research and data collection instead of directly sitting down to design a pedal. Observing the master’s work is always a great place to start learning a new concept!
While I’ve watched several demonstrations and used several unique guitar pedals and made some myself that produce the craziest of sounds, I’ve always wanted to understand the effects through a more visual representation.
And so, I hooked up a simple setup involving a guitar pedal, an oscilloscope, and a function generator to see how a digital guitar pedal manipulates a clean input sinusoidal signal. Afterall, an audio signal is nothing more than several superimposed sinusoidal waves with different frequencies (Fourier series).

Equipment Used-
Guitar Pedal- zoom-G1xon Multi-effects digital pedal
Oscilloscope-KeySight- DSOX2004A Oscilloscope
Function Generator- Scientech 416 Arbitrary/function generator
The idea is quite straight-forward. By feeding in a well-defined input signal to a guitar pedal/signal manipulator, the output observed via an oscilloscope would give us a clear picture of how much the input signal has been tweaked.
Anyways apart from the tech talk, the oscilloscope plots are absolutely beautiful!
Here’s the input signal (A plain sine wave fed through a function generator)-

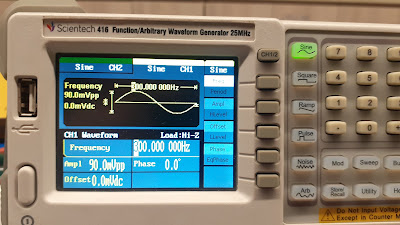
Another day, I directly connected an electric guitar to an oscilloscope to get a rough idea about the guitar’s peak voltage (90mV in my case)and frequency range in general.
It’s not easy to find out the frequency range of a guitar’s input signal due to high-frequency noise/harmonics. However, the Fast Fourier Transform function on the DSO does give you a rough estimate of frequencies present in the clean signal.
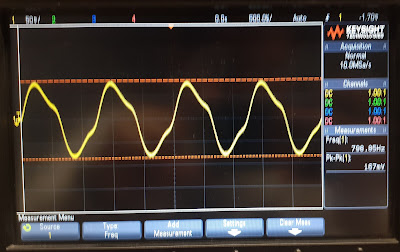
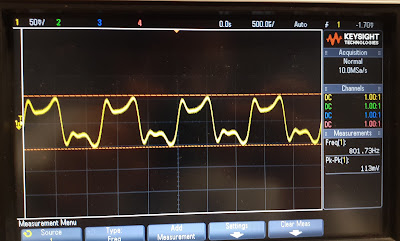
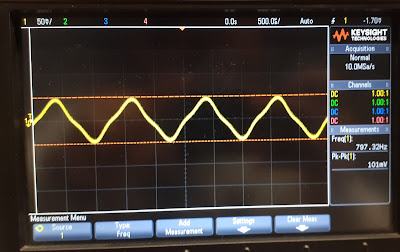
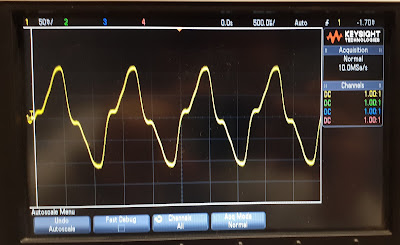
And finally here’s what you probably came for, the oscilloscope plots for some of the most iconic effects the pedal offers!
1. Big Wah

2. Big Muff

3. Blue Lead

4. DX Crunch
5. Legato Hero
6. OCT GTR

7. Power Lead

8. Wakapon

9. Texas Tone
10. Fuzz Orange
11. LA Lead

12. Snac Monster
This has to be probably the most unique sounding effect, that the pedal offers, with the most distinguished oscilloscope plot.

13. Brighton

14. Nashville

Do keep in mind all of the plots, above and below, were obtained by using the same simple sine wave input signal. Yet, the complexity of output signals is mind-boggling.
Also, not very surprisingly, the pedal also has a lot of dynamic effects that superimpose another parallel signal onto the input signal to create time-varying effects such as tremolo.
Time-Varying effects
15. Green Big
16. Phase City
17. Chorus Pad
18. Rock Tone

All in all, it was quite interesting to observe the variety of ways in which a signal can be manipulated while still retaining a somewhat characteristic tone. I plan to do a similar analysis, another day with a different pedal. For now, I have a clearer idea of the kind of effects I’d like to implement on my guitar pedal.
Cheers
-Siddharth
Leave a Reply